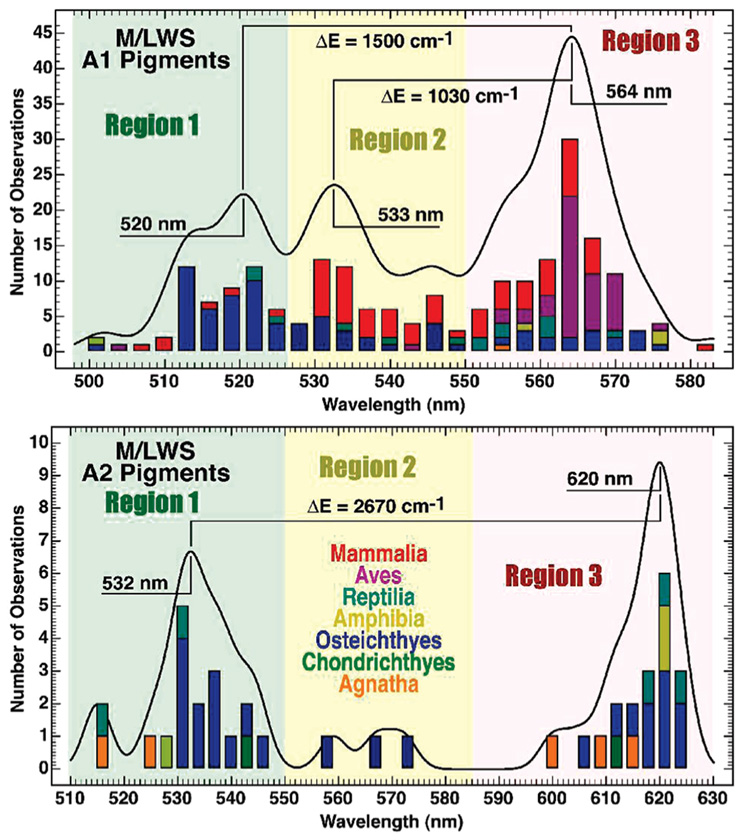
FIGURE 3.
Histogram analysis of 294 M/LWS pigments reveals the distribution of absorption maxima into two or three regions of the visible spectrum for A1 (top) and A2 (bottom) pigments. We refer to those red cones with absorption maxima in region 3 as “deep red” cones and propose that these pigments have 6-s-trans chromophores. The literature data and associated references are listed in Tables S1 and S2 of the Supporting Information.

