Figure 7.
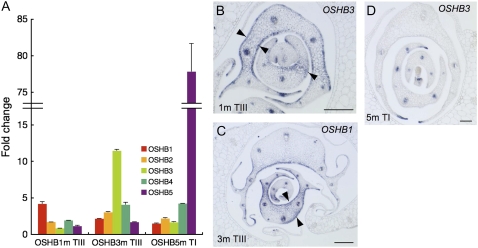
Effect of pACT∷OSHBm expression on leaf polarity. A, Real-time RT-PCR analysis of five OSHB genes in pACT∷OSHB1m plants showing Type III phenotype (see Table I; left), in Type III of pACT∷OSHB3m (middle), and in Type I of pACT∷OSH5m (right). Fold-change relative to the vector control plant is shown. Expression level was normalized to that of eEF-1α. Bars indicate sd. B, In situ localization of OSHB3 transcripts in Type III pACT∷OSHB1m shoot apex. Arrowheads indicate OSHB3 expression on both the adaxial and abaxial sides of the leaf primordia. C, In situ localization of OSHB1 transcripts in Type III pACT∷OSHB3m shoot apex. Arrowheads indicate OSHB1 expression on both the adaxial and abaxial sides of the leaf primordia. D, In situ localization of OSHB3 transcripts in Type I pACT∷OSHB5m shoot apex. Scale bars in B to D =100 μm.

