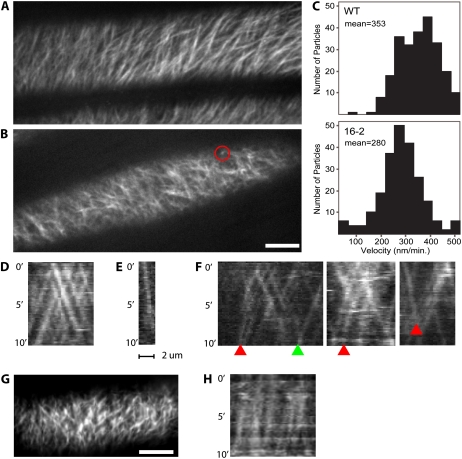
Figure 8.
CESA6:YFP dynamics are altered in kor1-3 and kor1-1. A and B, Average of 60 frames acquired over 10 min in wild type (A) and kor1-3 (B). Red circle in B marks a slow moving particle (78 nm/min) that is seen as a bright spot in the average projection. Scale bar = 10 μm. C, Histogram of measured particle velocities; the mean is 353 nm/min in wild type and 280 nm/min in kor1-3. D to F, Kymographs from 10-min observations of wild type (D) and kor1-3 (E and F). Particle velocities are constant in the wild type (D); note the linear streaks. Kymograph (E) corresponds to the slow moving particle marked by the red circle in B; note the shallow slope indicating slow movement. Particle velocities can be seen to slow down in kor1-3 during the period of imaging (F; arcing streaks indicated by red arrowheads), while the particle marked with a green arrowhead remained at a constant velocity. G, Average projected image of kor1-1 as in A and B. H, Kymograph of YFP:CESA6 in kor1-1 showing consistently slow velocities measured to be 143 ± 43 nm/min (n = 50). Scale bar = 10 μm.

