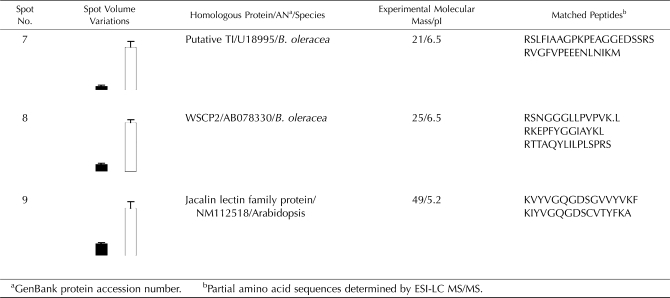
Table III.
Identification of spots highly induced by MeJA after 7 d of treatment
Spots are presented in Figure 6. The normalized volume of each spot identified was indicated for control (black) and MeJA treatment (white). Vertical bars indicate ±se of the mean (n = 3). Experimental pI and molecular mass for the ESI-LC MS/MS-identified peptides are also indicated. The assigned protein of the best matched is given with the organism in which it has been identified and its GenBank protein accession number.

