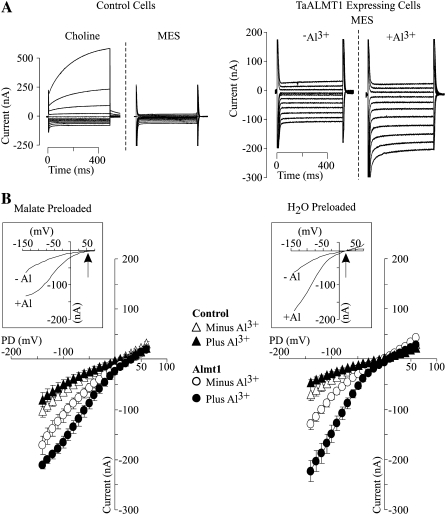
Figure 6.
A, Examples of families of currents recorded from control (left) or TaALMT1-expressing (right) cells preloaded with malate and bathed in MES solution in response to voltage pulses ranging from −140 to +80 mV or −140 to +60 mV, respectively. Both types of cells were preloaded with malate. The left panel (control cells) compares endogenous currents obtained when the choline chloride bath solution was replaced with MES bath solution (see Table I). The right panel compares the TaALMT1 currents obtained in MES bath solution lacking (−) or containing (+) 100 μm AlCl3. B, Mean I/V relationships for TaALMT1 (circles) and control (triangles) cells preloaded with malate (left) or water (right) recorded in MES bath solution prior to (white symbols) and following (black symbols) the addition of 100 μm AlCl3 to the bath solution, obtained from recordings similar to those shown in A (n = 6). The inset for each set of I/V curves highlights the magnitude and the Erev (arrow) of the net inward TaALMT1-mediated current obtained after subtraction of the endogenous currents recorded in control cells.

