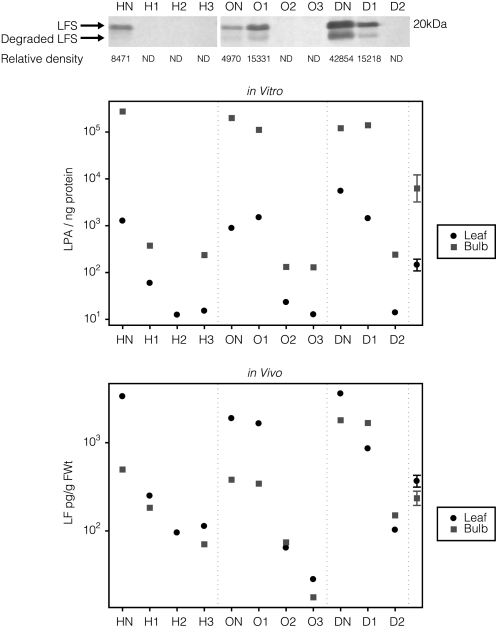
Figure 4.
Biochemical analysis. Top, Western-blot analysis of LFS. Middle, In vitro LF peak area (LPA). Bottom, In vivo LF measurements. HN, ON, and DN indicate nontransgenic hybrid, open-pollinated, and dehydration control, respectively; H1, H2, H3, O1, O2, O3, D1, and D2 represent specific transgenic hybrid, open-pollinated, and dehydration onion plants. The 95% confidence limit is calculated by analysis of log-transformed data of within-bulb and within-leaf variation to account for the variance difference between the low and high LF values. ND, Not detected.

