Figure 3.
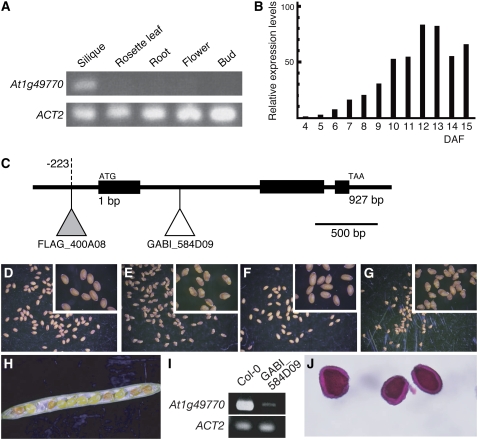
Loss-of-function At1g49770 mutants. A, RT-PCR showing At1g49770 mRNA levels in different organs (rosette leaves, buds, flowers, siliques, and roots). B, Real-time PCR analysis showing At1g49770 mRNA levels in developing siliques of wild type. Relative expression levels: expression levels in each developmental stage relative to 4 DAF. C, The T-DNA insertion sites in loss-of-function mutants. The white and gray triangles indicate the T-DNA insertion sites in GABI_584D09 (ecotype Col-0) and FLAG_400A08 (ecotype Ws), respectively. D to G, The seed phenotypes of Col-0 (D), GABI_584D09 (E), Ws (F), and FLAG_400A08 (G). A magnified image is inset. H, The phenotype seen in opened siliques from crosses of GABI_584D09 and wild type. I, RT-PCR showing At1g49770 mRNA levels in siliques of wild type and GABI_584D09. J, Ruthenium red-stained seed coat mucilage phenotype of GABI_584D09 seeds.

