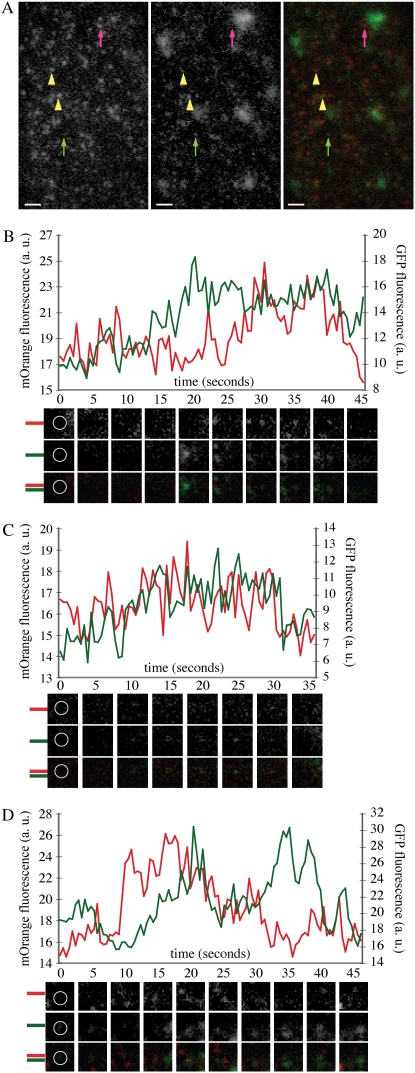
Figure 4.
DRP1A-mOrange foci colocalize with CLC-GFP foci in the cell cortex. A, Epidermal root cell in the expansion zone expressing DRP1A-mOrange and CLC-GFP imaged with VAEM with filter set for simultaneous GFP and mOrange fluorescence capture (see “Materials and Methods”). DRP1A-mOrange and CLC-GFP foci are present independently (DRP1A, pink arrow; CLC, green arrow) and also colocalize (yellow arrowheads). B to D, Intensity profiles of GFP (green) and mOrange (red) fluorescence from foci that had overlapping fluorescence of CLC-GFP and DRP1A-mOrange. Corresponding mOrange fluorescence (top), GFP fluorescence (middle), and merged (bottom) images are below each time (in seconds) indicated in the graph. Montage images are 1.2 × 1.2 μm. White circles in the first frames indicate measured regions for fluorescence intensity. Bars = 1 μm.

