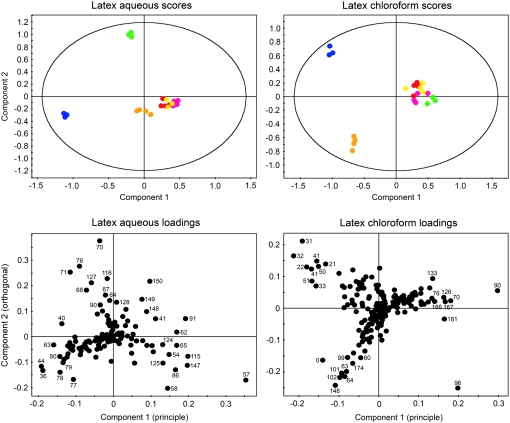
Figure 2.
Score and loading plots for unsupervised, pareto-scaled two-dimensional PCA of NMR spectral data obtained for aqueous or chloroform extracts of opium poppy latex. NMR spectra for aqueous and chloroform extracts were obtained in D2O and CDCl3, respectively. For score plots, samples representing six plant varieties are color coded as follows: L, red; M, orange; P, blue; T, green; 11, yellow; 40, pink. For loading plots, bin numbers corresponding to those listed in Table I (aqueous) and Supplemental Table S1 (chloroform) are indicated.

