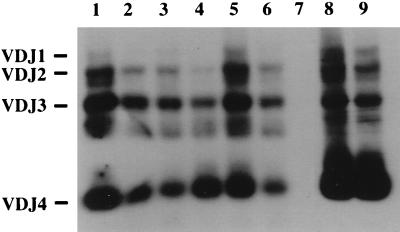
Figure 7.
PCR analysis of IgH rearrangements. PCR products of different VDJ recombination events are indicated on the left. Lanes 1 and 2 contain amplified DNA from the spleen and thymus of a control mouse. Lanes 3 and 4 contain DNA from a mouse with a myeloid hyperplasia of the spleen and the unaffected thymus. Lanes 5 and 6 contain DNA from a spleen and thymus with lymphoid hyperplasia in the spleen. Lanes 7–9 contain amplified DNA from a mouse with lymphoma cells in both the spleen (lane 8) and thymus (lane 9). The liver DNA sample (lane 7) served as a negative control.

