
Figure 5.
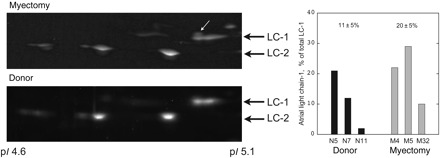
Myosin light chain detection by two-dimensional electrophoresis. Thirty micrograms of myofibrils were separated by 2D electrophoresis and stained with SYPRO Ruby. The region of the gels showing VLC-1, ALC-1, and MLC-2 are shown. VLC-1 (MYL3-HUMAN) has a pI of 5.03 and Mr of 21 800 Da, ALC-1 (MYL4-HUMAN) has a pI of 4.98 and Mr of 21 433 Da. ALC-1 was identified in a sample of mouse heart atrium located above and to the left of VLC-1 and was found to be present in all samples tested but more prominent in the myectomy samples (arrow). Densitometry of ALC-1 and VLC-1 spots was performed manually and the ratio of the two isoforms is plotted on the left. Values were quite variable with a trend towards higher ALC-1 content in the myectomy samples.