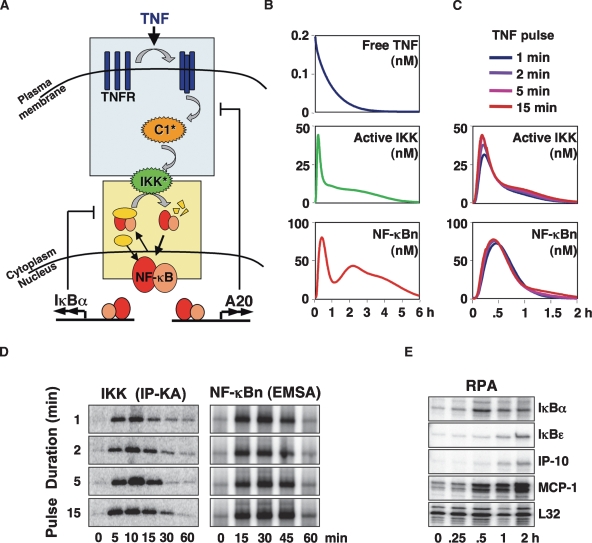
Figure 1.
A mathematical model of TNFR signaling to NF-κB. (A) Schematic depicting TNF signaling from TNFR to IKK, which functions as the input to the NF-κB signaling module. The two most rapidly NF-κB-inducible attenuators, IκBα and A20, are shown. A detailed schematic of the model is available in the Supplemental Material. (B) Computational simulations of persistent TNF stimulation depicting free TNF levels and the activities of IKK and NF-κB. (C) Computational simulations of IKK (top) and NF-κB (bottom) activities in response to 1-, 2-, 5-, or 15-min TNF pulses. (D) IKK and NF-κB activities were experimentally measured in wild-type MEFs in response to 1-, 2-, 5-, or 15-min 1 ng/mL TNF pulses via in vitro IP-kinase assay and EMSA, respectively. (E) RPA to track expression of NF-κB target genes in wild-type MEFs stimulated with a 1-min pulse of TNF (1 ng/mL).

