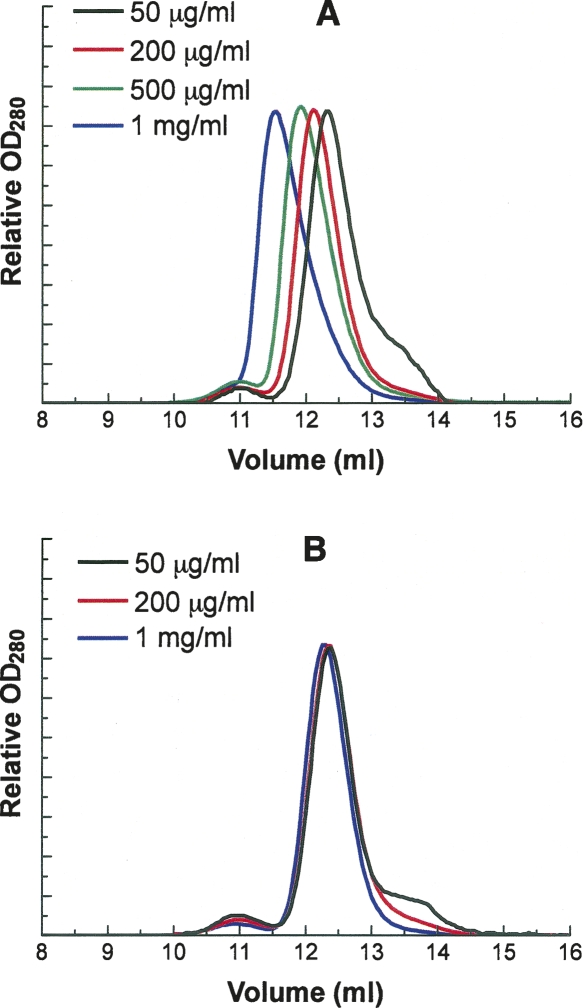
Figure 6.
Gel-elution profile of native G6PD and stripped G6PD by FPLC. One hundred microliter samples of different G6PD protein solutions were loaded on a Superdex 200 HR 10/30 column equilibrated with 0.1 M Tris-HCl, 150 mM NaCl (pH 7.6). To facilitate comparison, the absorbance of each protein peak is shown as a relative value rather than an absolute unit. (A) Apparent molecular weights of native G6PD peaks at different protein concentrations: 50 μg/mL, 101.5 kDa (12.33 mL) and 203.6 kDa (10.95 mL); 200 μg/mL, 112.9 kDa (12.12 mL) and 200.6 kDa (10.98 mL); 500 μg/mL, 124.9 kDa (11.92 mL) and 198.6 kDa (11.00 mL); and 1.0 mg/mL, 150.5 kDa (11.55 mL). (B) Apparent molecular weights of stripped G6PD peaks at different protein concentrations: 50 μg/mL, 100.01 kDa (12.36 mL) and 204.66 kDa (10.94 mL); 200 μg/mL, 100.52 kDa (12.35 mL) and 201.6 kDa (10.97 mL); and 1.0 mg/mL, 104.9 kDa (12.28 mL) and 200.6 kDa (10.98 mL).

