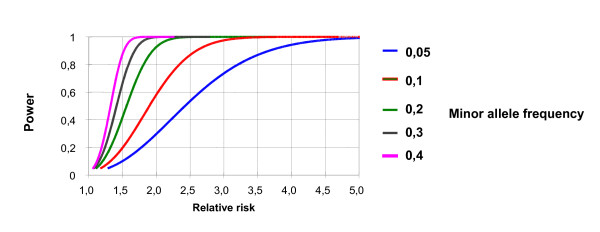
Figure 1.
Power estimates for association tests. The figure shows the power (y-axis) of association studies for a range of different minor allele frequencies (0.05–0.40) and varying relative risks (x-axis). The figure demonstrates that power estimates are robust over a wide range of minor allele frequencies that can be expected for the SLC10A2 variants.

