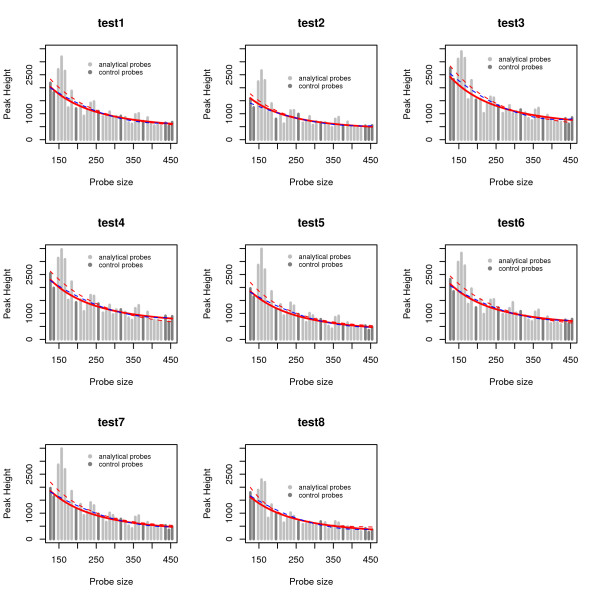
Figure 3.
Regression estimates for the test samples from BRCA1 data set. Regression estimates for each of the 8 test samples given in the example provided by the NGRL-Manchester called P002 BRCA1. Red lines are estimated using the nonlinear mixed model. The solid lines are estimated using control probes, while dotted lines are obtained after using the median filter approach. The dotted blue lines are showing the regression estimates using quadratic model. These regression lines are then used to normalize the peak intensities.

