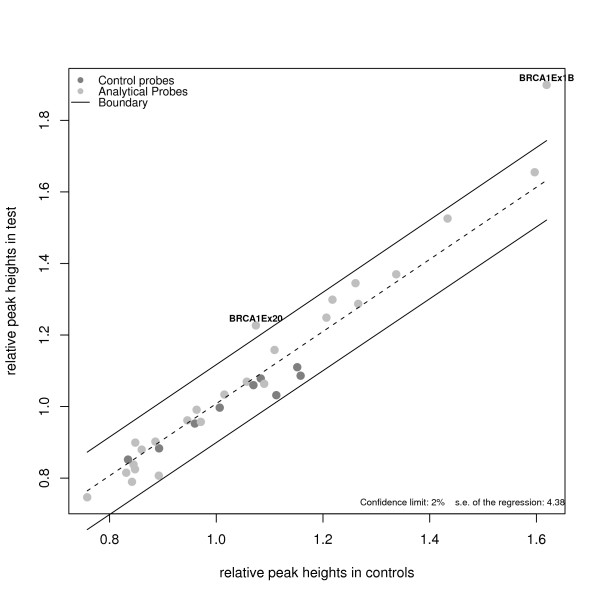
Figure 4.
Normal control comparison procedure using iterative regression. Plot of normalized peak intensities in controls (calculated as the mean of all controls) against normalized peak intensities in test sample number 1 using iterative regression procedure. Dotted line correspond to linear regression among those probes that are considered non altered after applying the iterative procedure. Solid lines determine upper and lower boundaries which are used to indicate whether or not a given probe is a duplication or a deletion, respectively.

