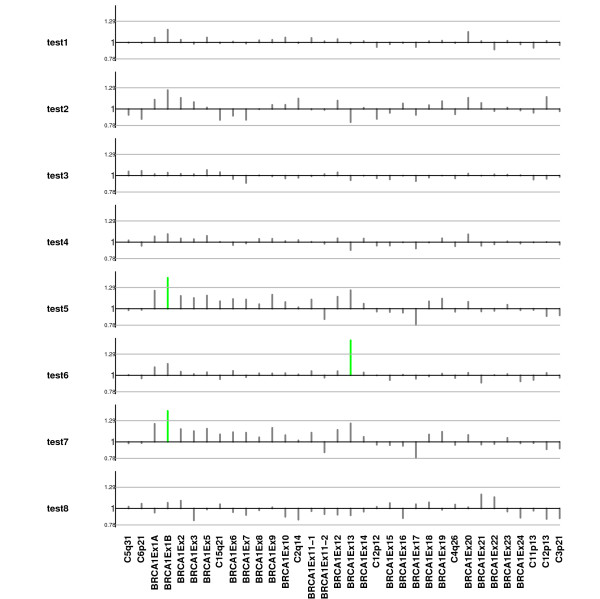
Figure 5.
Normal control comparison procedure using tolerance interval criteria. Plot of ratio between normalized peak intensities in controls against normalized peak intensities in each of the 8 test samples (vertical lines). Horizontal gray lines indicate lower and upper boundaries obtained using the linear mixed model and tolerance interval criteria. Vertical green lines are indicating that those probes are duplicated for the corresponding probe.

