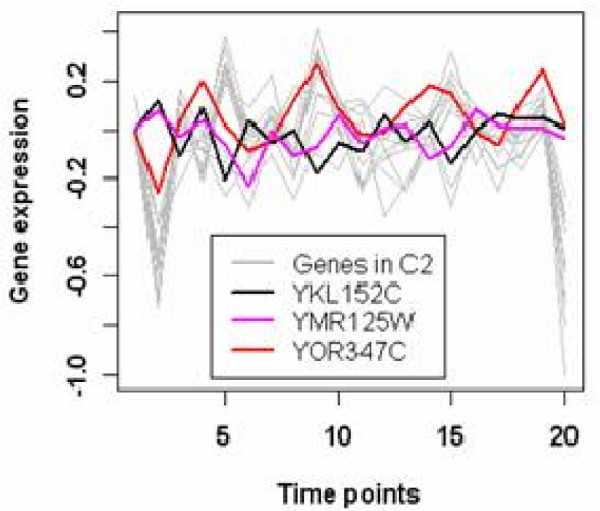
Figure 10.
Scattered genes in original cluster 2 of the Yeast Galactose dataset. The expression profiles of some scattered genes detected by the proposed algorithm are plotted for the Yeast Galactose dataset. This plot shows the expression patterns of all 15 genes in original cluster 2, among them the 3 colored genes are the detected scattered genes;

