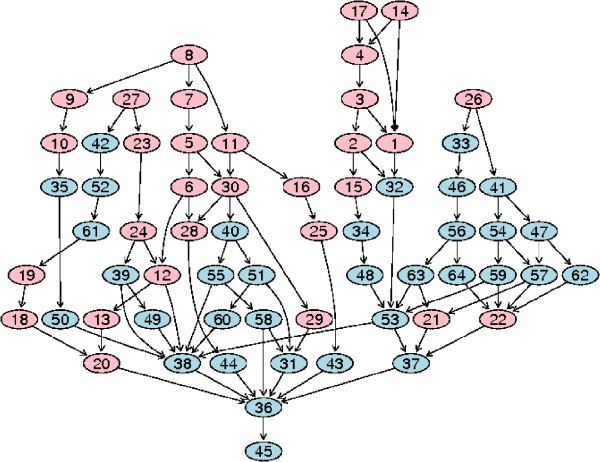
Figure 4.
An example of the GO tree graph. Each number in a node can be mapped to a GO term in the corresponding GO term table (Supplementary Table 2 of Additional File 2). The over-represented terms are marked as pink, listed in the table together with their p-values and counted number of associated genes.

