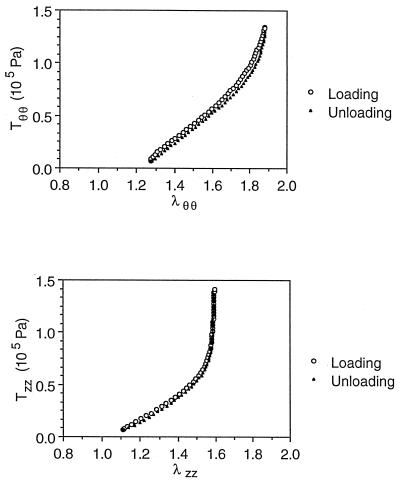
Figure 1.
The stress–strain curves recorded in protocol 1 for specimen No. 27. Open circles denote the loading curve and solid triangles denote the unloading curves. The unloading curve differs very little from the loading curve so that the hysteresis can be neglected. The linear region is rather long.

