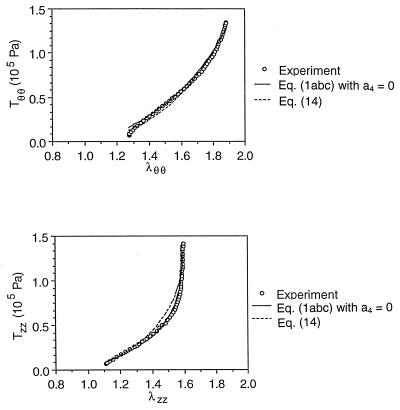
Figure 3.
Comparison between the theoretical and experimental loading stress–strain curves. The experimental curves are the same as in Fig. 1. The theoretical curves are calculated based on Eqs. 1a–c with a4 = 0 (solid lines) and Eq. 14 (dashed lines). Good agreements are observed for both strain energy functions with Eqs. 1 a–c presenting a better fit.

