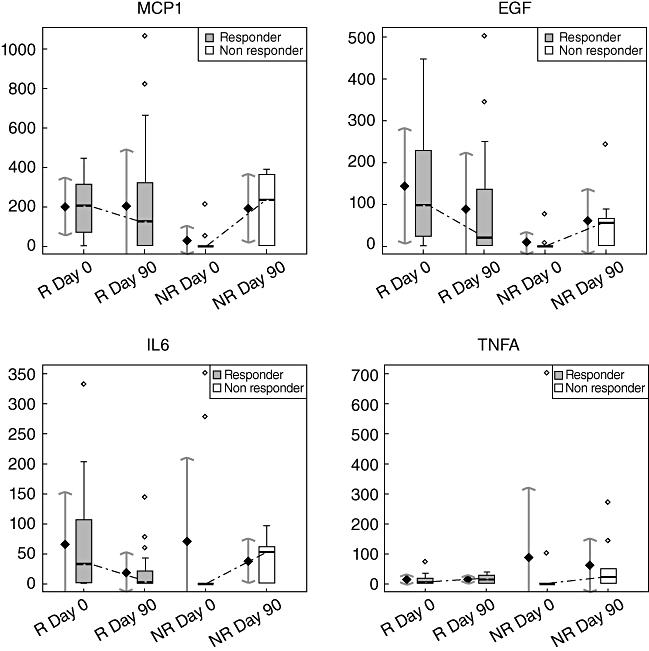
Fig. 1.

Cytokine level evolution during etanercept treatment in the responder (R) and non-responder (NR) groups. Box-plots are on the right and representations of the mean (±standard deviation intervals) on the left in each group at each time (MCP1, monocyte chemoattractant protein-1; EGF, epidermal growth factor; IL6, interleukin-6, TNFA, tumour necrosis factor-α).
