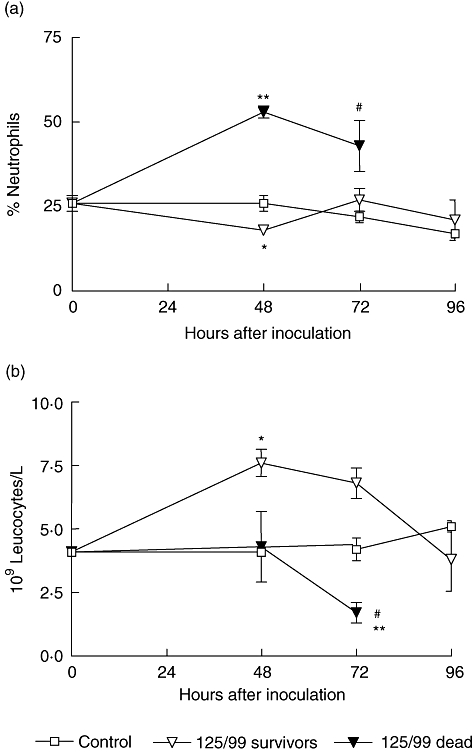
Fig. 3.

Peripheral white cell count after bacterial inoculation. Mice were bled at 48, 72 and 96 h after oral inoculation and total and differential leucocyte counts were evaluated. In the figure, each point represents the mean ± standard error of the mean of three to nine mice. Infected mice (125/99) were classified retrospectively according to their evolution into survivors or dead. (a) Percentage of neutrophils. All data were analysed by analysis of variance (anova) multiple comparison test (P < 0·0001) and a posteriori Student–Newman–Keuls test. *P < 0·05 versus control; **P < 0·001 versus control and 125/99 survivors; #P < 0·05 versus control and 125/99 survivors. (b) Absolute count of total white cells. All data were analysed by anova multiple comparison test (P < 0·02), and a posteriori Student–Newman–Keuls test. *P < 0·05 versus control and dead mice; **P < 0·001 versus survivors; #P < 0·05 versus control mice.
