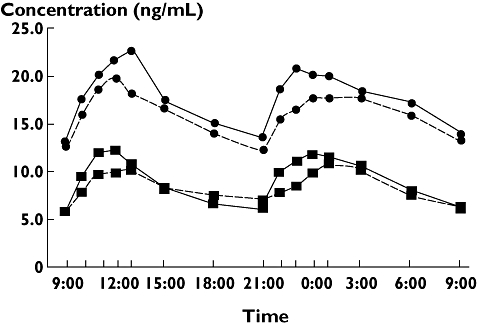
Figure 2.

Blood concentration–time profiles of tacrolimus in CYP3A5 expressers and non-expressers on day 28 and >1 year postoperatively. Each point represents the mean on day 28 and >1 year after transplantation. CYP3A5 expresser at day 28, ( ); CYP3A5 nonexpresser at day 28, (
 ); CYP3A5 expresser more than 1 year, (
 ); CYP3A5 nonexpresser more than 1 year, (
 )
)
