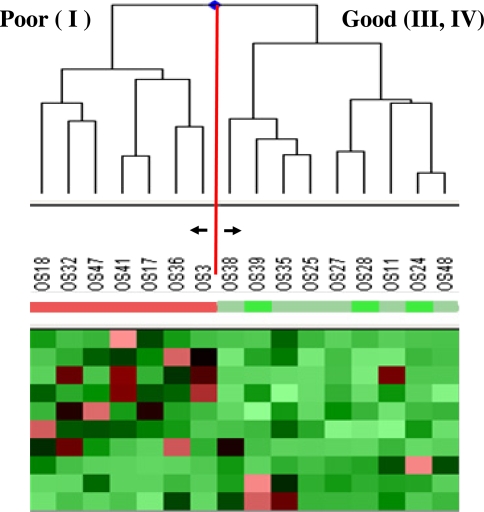
Fig. 5.
Expression pattern of the 10 protein spots that discriminate good responders (Huvos Grades III, IV) from poor responders (Huvos Grade I) among 16 patients with osteosarcoma. Horizontal rows represent individual protein spots, and vertical columns represent individual samples. Each cell in the matrix represents the expression level of a single protein spot in a single sample. Red indicates overexpression relative to the expression of the control sample, whereas green indicates underexpression. There are seven spots that are overexpressed in poor responders and three spots overexpressed in good responders.

