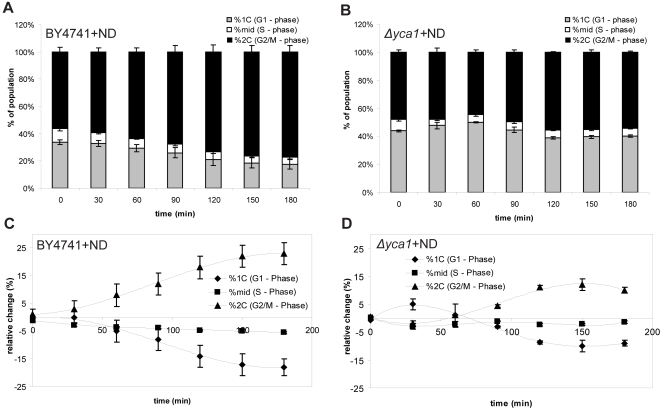
Figure 3. Response of cells to nocodazole.
DNA content profile of wild-type (a) BY4741 and (b) Δyca1 cells over time after treatment with 15ug/mL nocodazole. Relative change in population between nocodazole treated and untreated (c) BY4741 and (d) Δyca1 cells. For each phase the value represents the difference between population of nocodazole treated and untreated cells (value = treated–untreated). (N = 3, ±S.E.M. for all).

