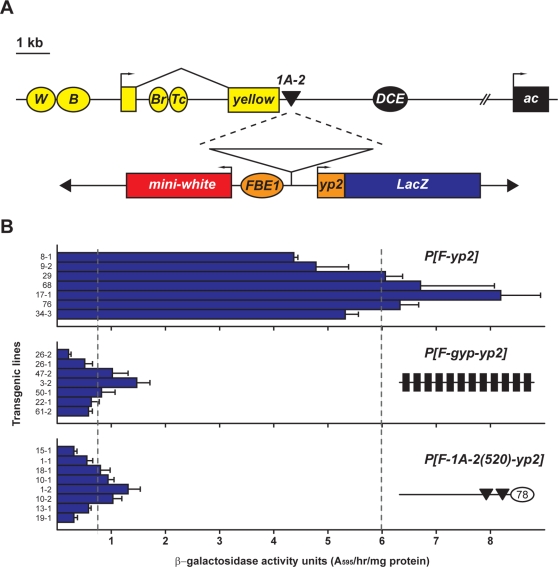
Figure 1. The 1A-2 insulator.
A. Top: The cuticle pigmentation yellow (y) gene contains two exons (yellow rectangles) and four tissue specific enhancers (ovals marked W for wing, B for body, Br for bristle and Tc for tarsal claw). The proneural achaete (ac) gene contains one exon (black rectangle). The tissue-specific enhancer in the upstream regulatory region is shown (oval marked DCE for dorsocentral enhancer). 1A-2 Su(Hw) BR is located downstream of the y gene, separating this gene from the ac regulatory region. Bottom: Structure of the FBE1-yp2-LacZ transgene used to define the sequences of 1A-2 required for enhancer blocking. Subregions of 1A-2 were inserted between the FBE1 enhancer and yp2 promoter. Effects of transcriptional activation were determined through enzymatic assay that tested β-galactosidase activity. The mini-white (w) gene was used for identification of transgenic flies in germ line transformation. B. β-galactosidase activity associated with transgenic lines carrying transposons derived from FBE1-yp2-LacZ. Each bar represents the average activity units (aau) for independent insertion lines corresponding to the indicated transposon (right). When pertinent, a cartoon is shown that represents the structure of sequences included in the FBE1-yp2-LacZ transgene. The gypsy Su(Hw) BS are shown as black rectangles, the 1A-2 Su(Hw) BS are shown as black triangles, a novel 1A-2 element is shown as an oval carrying 78 bp. Assays were completed on extracts isolated from females representing at least three independent crosses. Error bars indicate standard deviation. The vertical dashed line on the left represents the aau value for flies carrying P[F-gyp-yp2], while the vertical dashed line on the right represents the aau value for flies carrying P[F-yp2].

