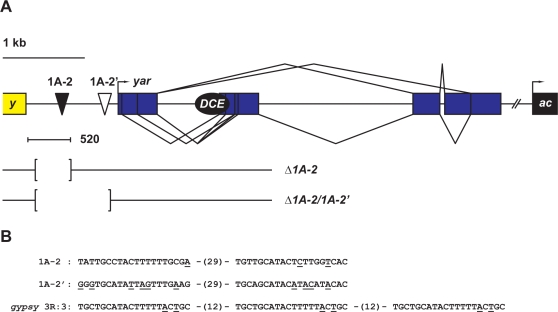
Figure 4. Detailed structure of control elements in the region separating the y and ac genes.
A. The region separating the y and ac genes contains a cluster of two strong Su(Hw) BS (black triangle, 1A-2) and two weak Su(Hw) BS (white triangle, 1A-2′). 1A-2′ is located 85 bp upstream of the most upstream yar transcription start site (bent arrow). The alternative splicing pattern is shown: thin lines represent introns and blue rectangles indicate exons. The ac DCE (black oval) resides within yar. The limits of the original 520 bp 1A-2 insulator are shown as a bracketed line marked 520. The extent of the regions deleted in the yΔ1A-2 (Δ1A-2) and yΔ1A-2/Δ1A-2′ (Δ1A-2/1A-2′) flies are shown, where the bracketed regions were removed. B. The sequence of the Su(Hw) BSs in 1A-2 (top), 1A-2′ (middle), and the synthetic gypsy insulator (3R:3) (bottom), with the numbers indicating the distance of separation between BSs. The nucleotides different from the genomic Su(Hw) consensus BS [14] are underlined.

