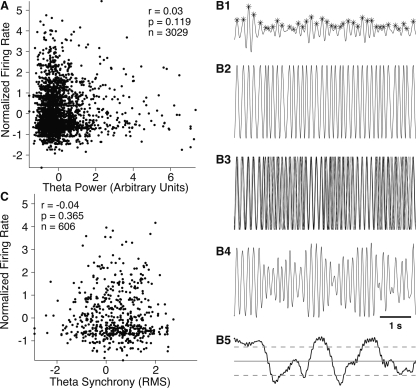
Figure 3.
Increased theta power or synchrony is not associated with higher firing rates in mPFC neurons. (A) Firing rates of mPFC neurons (Y-axis, n = 125, expressed as Z-scores) vs. theta power (X-axis) during quiet waking. (B) Method used to quantify theta synchrony at simultaneously recorded mPFC sites. (B1) In each LFP, theta peaks and troughs were identified. (B2) To extract phase, maxima and minima points were assigned a zero and pi value, the signal was linearly interpolated between them, and then cosined. This created a pure phase signal with no amplitude. (B3) Phase signal for eight simultaneously recorded mPFC sites. The phase information is then averaged across sites (B4) and synchrony quantified by computing the root mean square (RMS) of the averaged signal (B5). Dashed lines show 2.5% confidence intervals obtained by computing mean and SD over a 1-h recording period. (C) mPFC firing rates (Y-axis) vs. theta synchrony (X-axis) during quiet waking. The values of theta synchrony are expressed as Z-scores in order to allow plotting of all the cells together in one figure.

