
Figure 5.
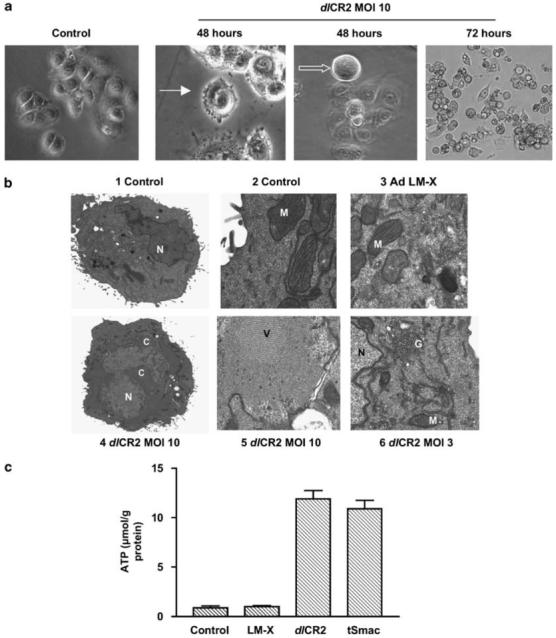
Cell architecture and necrosis. (a) Cells were infected with dlCR2 and imaged up to 72 h later under phase contrast microscopy. After 48 h, individual cells show membrane blebbing (solid arrow) and appear rounded (open arrow). By 72 h, widespread cell rounding and detachment is seen, but without disruption to cell membranes. (b) IGROV1 cells were infected with Ad LM-X (MOI 10) or dlCR2 (MOI 3 and 10) and prepared for TEM 72 h later. (i and ii) Mock-infected control cells; (iii) Ad LM-X (MOI 10); (iv and v) dlCR2 (MOI 10); (vi) dlCR2 (MOI 3). C, condensed chromatin; G, disrupted Golgi; M, mitochondria; N, nucleus; V, intra-nuclear virus assembly. (c) IGROV1 cells were infected with Ad LM-X, dlCR2 and dlCR2 tSmac (all MOI 10). Intracellular adenosine triphosphate (ATP) levels were measured 72 h later using a luciferase-based assay as detailed in the ‘Materials and methods’ section. Results represent mean±s.d., n=3.