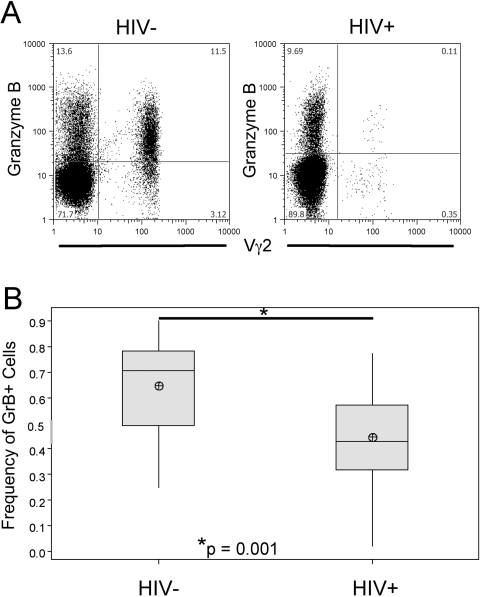
Fig. 2.
Frequency of GrB+ cells from HIV+ and control donors. (A) Representative samples of HIV+ (PD011) and control (ND008) donors showing GrB versus Vγ2. (B) Average frequencies of GrB+ cells in total Vγ2+ population from HIV+ (n=24) or control donors (n=16). Shaded boxes represent interquartile range (IQR) of distribution, horizontal line represents the median, and crossed circles represent sample mean; whiskers mark distance from IQR to the furthest point that is not an outlier, and outliers are defined as >1.5 × IQR from the edge of the box. P value is a result of Student’s t-test.

