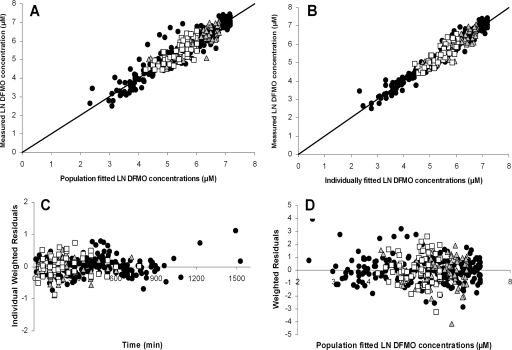
FIG. 5.
Basic goodness-of-fit plots for the absorption model with fixed disposition parameter values. The measured d-eflornithine (gray triangles), l-eflornithine (white squares), and racemic eflornithine (black circles) concentrations were plotted versus the population fitted concentrations (A) and the individually fitted concentrations (B). Individually weighted residuals were plotted versus time (C), and weighted residuals were plotted versus population fitted eflornithine concentrations (D).

