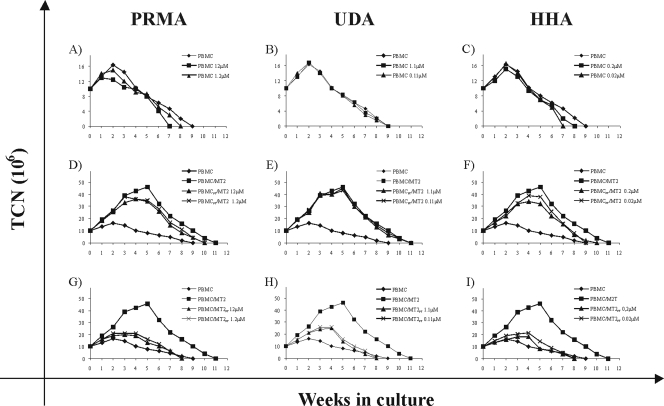
FIG. 4.
Effects of PRM-A, UDA, and HHA on the growth of uninfected (PBMC) or HTLV-1-infected cell (co)cultures (PBMC/MT-2). The growth values on the y axis were expressed as TCN, calculated from living-cell counts. For the first week, TCN was the actual number of cells, expressed as millions of viable cells, detected before the first adjustment, while in the succeeding weeks, TCN was calculated theoretically as the TCN in the previous week multiplied by the cell concentration, expressed as millions of viable cells per milliliter, detected before weekly adjustment. (A to C) Growth curves of uninfected PBMCs kept in IL-2 in the presence of PRM-A at 12 and 1.2 μM, UDA at 1.1 and 0.11 μM, and HHA at 0.2 μM and 0.02 μM or in the absence of CBAs (PBMC). (D to F) Growth curves of PBMCs pretreated with PRM-A at 12 and 1.2 μM, UDA at 1.1 and 0.11 μM, and HHA at 0.2 and 0.02 μM and cocultivated with irrMT-2 cells in the presence of IL-2. (G to I) Growth curves of PBMCs cocultivated with HTLV-1-infected irrMT-2 cells kept in IL-2 and pretreated with PRM-A at 12 and 1.2 μM, UDA at 1.1 and 0.11 μM, and HHA at 0.2 and 0.02 μM. An experiment representative of three performed with different donors is shown.

