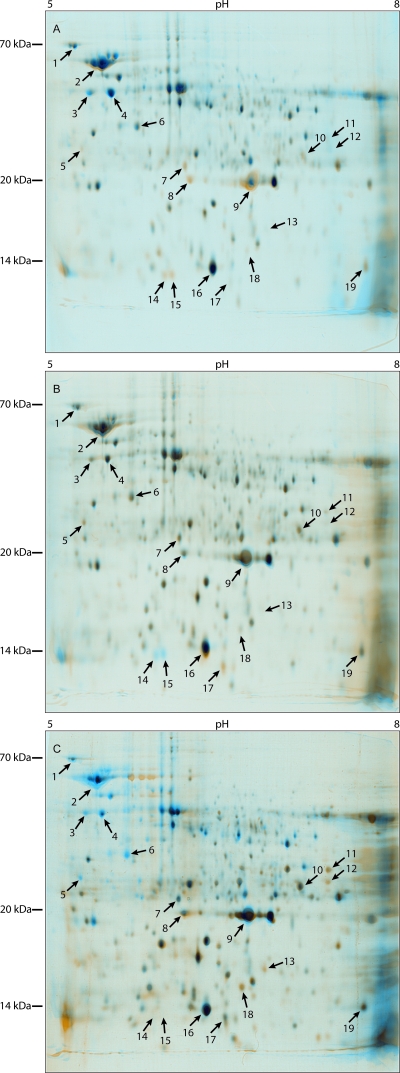
FIG. 3.
Changes in the R. eutropha H16 proteome during the time course of the experiment as revealed by 2D PAGE. Samples were taken from the cultivation experiment shown in Fig. 2. Proteins were focused using pH 5 to 8 nonlinear strips. Dual-channel image fusions were created with Delta 2D software. (A) Cells from the exponential growth phase after 8 h of cultivation with little PHB (blue spots) versus cells in the early stationary growth phase after 18 h of cultivation with maximum PHB (orange spots). (B) Cells from the early stationary growth phase after 18 h of cultivation with maximum PHB (blue spots) versus cells in the stationary growth phase after 21 h of cultivation (orange spots). Shortly before sample withdrawal, after 18 h, NH4Cl was added to a concentration of 0.8% (wt/vol), thereby initiating intracellular PHB mobilization. (C) Cells from the stationary growth phase after 21 h of cultivation (blue spots) versus cells in the later stationary growth phase after 33 h of cultivation and still mobilizing PHB (orange spots). The black spots in panels A, B, and C represent equally expressed proteins; the arrows indicate proteins that showed a temporary change in quantity. The proteins in spots 1 to 19 were isolated and analyzed by MALDI-TOF after tryptic digestion. The results of spot identification are listed in Table 2.

