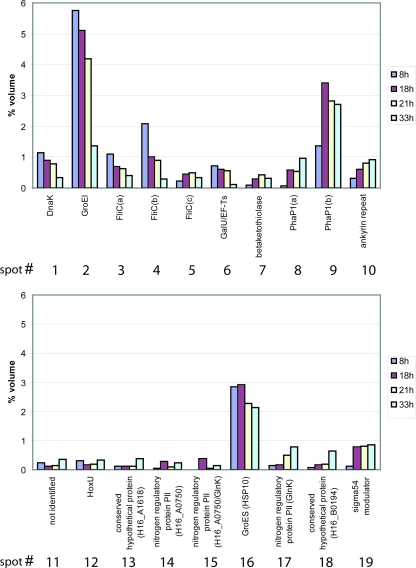
FIG. 4.
Quantification of protein spots in image fusions of 2D PAGE gels shown in Fig. 3. Spot quantities are given as percent volume (representing the relative portion in an individual spot of the total protein present on the respective average fusion image). Quantification was done with Delta 2D software.

