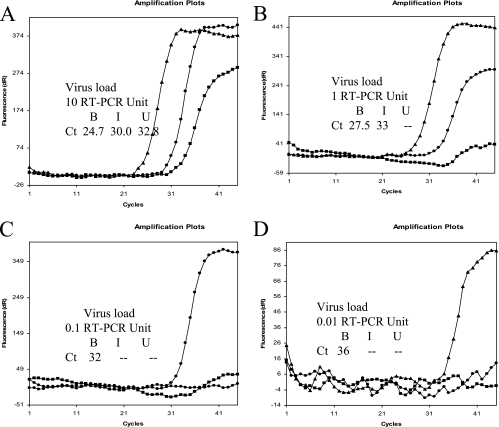
FIG. 2.
Concentration of NOR by PGM-MB. Samples containing various amounts of NOR were concentrated by PGM-MB. I (triangle), B (filled circle), and U (square) represent input, beads recovered, and unbound, respectively. Panels A, B, C, and D represent virus loads of 10, 1, 0.1, and 0.01 RT-PCR unit, respectively. The difference in Ct values between beads recovered and input B indicates that viruses are concentrated by using PGM-MB. A 3.3-fold difference in Ct values represents a 10-fold difference in concentrations. NOR can be concentrated at least 100-fold.

