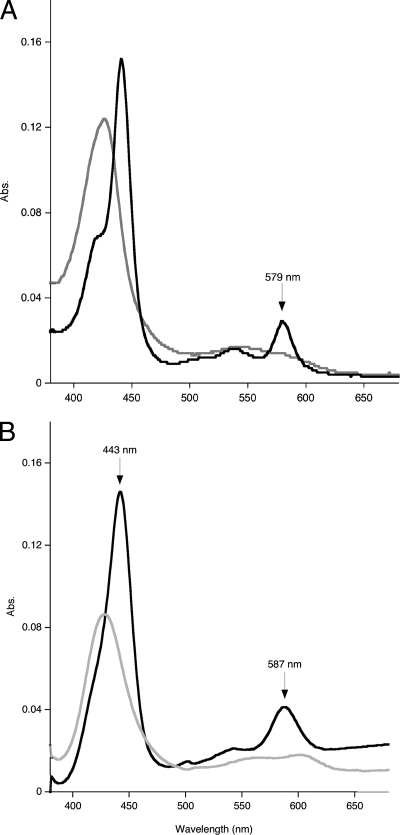
FIG. 2.
Visible spectroscopy of Cyt579. (A) Cyt579 (0.015 mg/ml) isolated from the C drift biofilm in 100 mM glycine-200 mM SO42−, pH 2.0, was treated separately with 5 μl of 10% Fe2(SO4)3 [23% Fe(III)] (gray line) and 5 μl of 1 mM sodium ascorbate (black line) in quartz cuvettes. The spectra were compared to those of the same solutions lacking Cyt579. (B) Cyt579 (1.5 mg/ml) was diluted by adding 50 μl into 450 μl of 0.2 M NaOH, 500 μM sodium ferricyanide (gray line) or 2 mM sodium dithionite (black line), and 500 μl of pyridine was added. Abs., absorbance.

