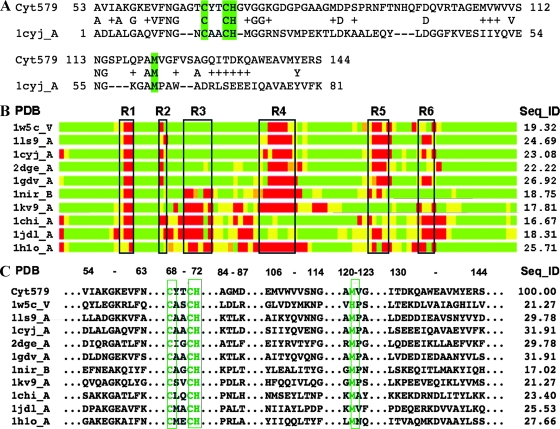
FIG. 7.
Modeling of Cyt579. (A) The initial structural model of Cyt579 was constructed based on sequence alignment with the structure of cytochrome c6, 1cyjA (13). In the alignment, amino acids repeated on the first and second lines are identical, and residues that are chemically similar to those of Cyt579 are indicated by plus symbols. Dashes indicate gaps in the alignment. Highlighted residues Cys68, Cys71, His72, and Met121 form the direct interactions with the heme. (B) Regions in the model having structures similar to those of corresponding regions in the structural templates analyzed are aligned in a schematic bar plot. Structural similarity with these templates is indicated as good (green), intermediate (yellow), and nonhomologous (red). Black boxes (R1 to R6) mark regions of structural deviation, or insertions/deletions, observed in structural templates. The region between R1 and R2 corresponds to the conserved CXXCH heme-binding motif. In Cyt579, the regions R1 to R6 correspond to the following fragments: R1, 65-AGT-67; R2, 73-GV-74; R3, 78-GDGPGA-83; R4, 93-FTNHQFDQ-100; R5, 115-SPLQPA-120; and R6, 126-SAGQI-130. (C) Residue-to-residue correspondences extracted from structurally conserved regions that were identified within a set of the closest structural templates. The results of the analysis of these regions increased confidence in the calculated sequence alignments used in modeling. The results from calculation of sequence identities between the templates and the model in structurally conserved regions are given in the column labeled “Seq_ID”; in most cases these values are higher than the corresponding Seq_IDs calculated for entire structural alignments shown in panel B.

