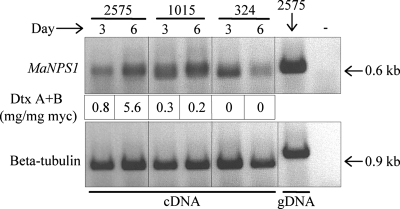
FIG. 3.
In vitro MaNPS1 gene expression by M. anisopliae. Relative expression levels of MaNPS1, detected by RT-PCR, correlated with an increase in destruxin production over time for M. anisopliae isolate ARSEF 2575 (M. anisopliae var. anisopliae; high producer) but not for isolates ARSEF 1015 (M. anisopliae var. majus; low producer) or ARSEF 324 (M. anisopliae var. acridum; low producer). The numbers under each lane of the top gel represent the average destruxin A+B production relative to the average dry weight of the mycelium (mg of destruxin A+B/mg of mycelium [myc]) per replicate culture at 3 days (six replicates/isolate) or 6 days (three replicates/isolate) postinoculation. The “+ control” was genomic DNA used as a template for the PCR; the “− control” was the PCR lacking template DNA. No signals were detected when DNase-treated RNA from each sample was used as a template (data not shown).

