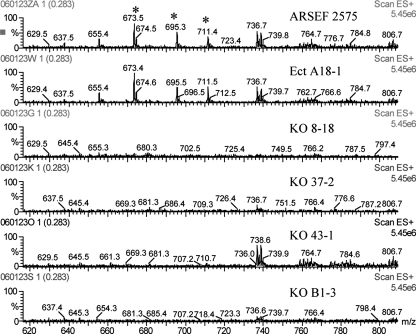
FIG. 6.
ESIMS analyses of conidial extracts from Δmanps1 mutants and control strains. Spectra represent the average of four scans, 3 s in duration, through the mass range m/z 2 to 1,202. The peaks denoted with asterisks at m/z 673, 695, and 711 Da are the pseudomolecular ions [M+H]+, [M+Na]+, and [M+K]+, respectively, of serinocyclin A.

