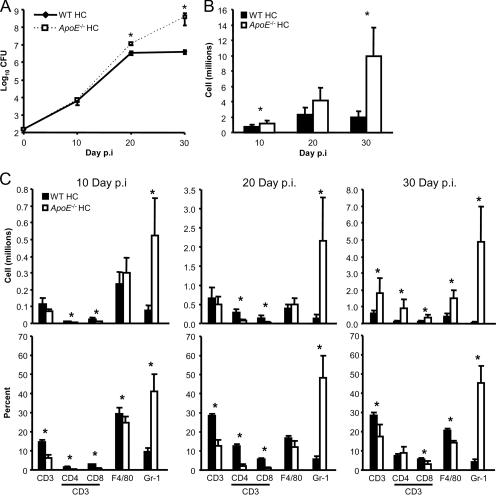
FIG. 2.
Despite a massive inflammatory response, ApoE−/− HC mice fail to control M. tuberculosis growth. (A) M. tuberculosis lung burdens of WT HC and ApoE−/− HC mice 10 days, 20 days, and 30 days after aerosol infection. The data are presented as mean log10 CFU ± standard deviations (SD). *, P < 0.05 (n = 4). (B) Lung leukocyte counts for the right caudal and left lung lobes of WT HC and ApoE−/− HC mice 10 days, 20 days, and 30 days after aerosol infection with M. tuberculosis. The values are the mean cell counts expressed in millions plus SD. *, P < 0.05 (n = 5). (C) The total numbers (top graphs) and percentages (bottom graphs) of T cells (CD3+ CD4+/CD8+), macrophages (F4/80+), or granulocytes (Gr-1+ CD3− F4/80−) isolated from the right caudal and left lung lobes of WT HC and ApoE−/− HC mice 10 days, 20 days, and 30 days after aerosol infection with M. tuberculosis Erdman. The total number of each cell population was determined by multiplying the percentage of cells positive for the above-mentioned surface markers by the total number of lung leukocytes isolated from each mouse. The values are the mean numbers of cells expressed in millions plus SD. *, P < 0.05 (n = 5). The results shown are representative of one experiment per time point, except for the CFU data for day 30 p.i., which is representative of two independent experiments.

