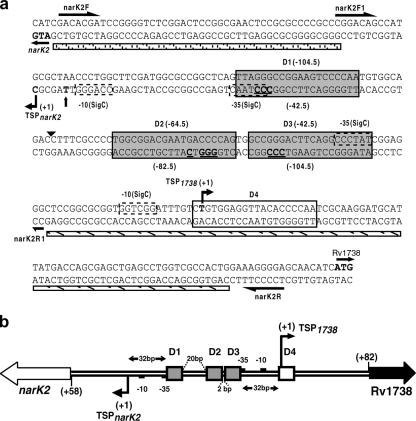
FIG. 5.
(a) Nucleotide sequence of narK2-Rv1738 intergenic region. TSPs (+1) are indicated by bent arrows. The putative −10 and −35 promoter elements are indicated by dashed boxes. The interacting Dev boxes, D1, D2, and D3, are indicated by gray rectangular boxes, and D4, which does not interact with DevR, is indicated by a white box. The positions of Dev boxes D1, D2, and D3 are indicated in parentheses with respect to the Rv1738 TSP above the sequence and with respect to the narK2 TSP below the sequence. The T→C nucleotide difference between M. tuberculosis and BCG is indicated by a vertical arrow. The upstream activating and the downstream inhibiting regions of the narK2 promoter in BCG (8) that were deleted in the present study (pnarK2Δup and pnarK2Δdn, respectively) are indicated by horizontal bars filled with diagonal lines and dots, respectively. The positions of primers are indicated by half-arrows. The arrowhead indicates the hypersensitive site. The bold underlined letters in the Dev boxes are the nucleotides that were mutated to their complementary nucleotides for various studies. (b) Map of the intergenic region. D1, D2, and D3 DevR binding sites are represented by shaded rectangular boxes. Box D4 (white box) does not interact with DevR. TSPs (+1) mapped in this study are shown by bent arrows. Putative −10 and −35 promoter elements are indicated by small black boxes. The distances between the DevR boxes and TSPs and between the binding sites are indicated (bp).

