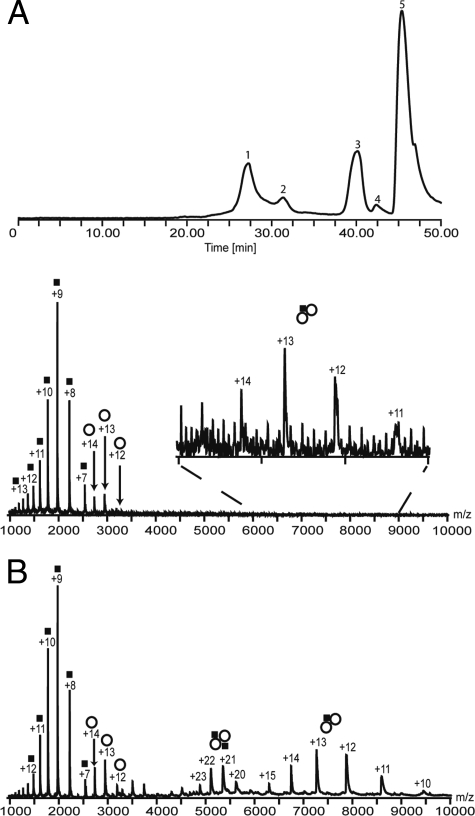
FIG. 5.
Online SEC-MS analysis of HQDO in the absence and presence of iron(II) sulfate and 4-hydroxybenzoate. (A) Elution ion chromatogram of HQDO without iron(II) sulfate and 4-hydroxybenzoate and subsequent analysis by ESI-MS (top). Peak 1 corresponds to HQDO; peak 2 corresponds to a 30-kDa protein, possibly the translation elongation factor Ts; and peaks 3 and 4 correspond to small molecules. Peak 5 is consistent with the void volume of the column. The ion chromatogram of HQDO with iron(II) sulfate and 4-hydroxybenzoate yielded a similar trace. ESI mass spectrum composed by combining scans from peak 1 of the ion elution chromatogram (bottom). This spectrum shows mainly two charge distributions between m/z 1,000 and 3,500. The first charge envelope (▪) corresponds to the α-monomer of HQDO with a mass of 17.8 kDa, the second charge distribution (○), corresponds to the β-monomer with a mass of 38.3 kDa, and the third charge state series corresponds with a molecular mass of 94.4 kDa (α1β2). (B) ESI mass spectrum of peak 1 in the presence of iron(II) sulfate and 4-hydroxybenzoate. This spectrum shows four major charge distributions. The first charge envelope (▪) ranging from +7 to +14 at m/z 1,000 to 2,600, corresponds with the α-monomer of HQDO with a mass of 17.8 kDa. The second charge distribution (○) ranging from +12 to +14 at m/z 2,700 to 3,200, refers to the β-monomer with a mass of 38.3 kDa. The third charge envelope from +20 to +23 at m/z 4,800 to 5,700, corresponds to the tetramer of HQDO (α2β2) with a mass of 112.4 kDa. The fourth charge distribution from +10 to +15 at m/z 6,300 to 9,500 refers to the trimer (α1β2) with a mass of 94.4 kDa. , α1β2 trimer; , α2β2 tetramer.

