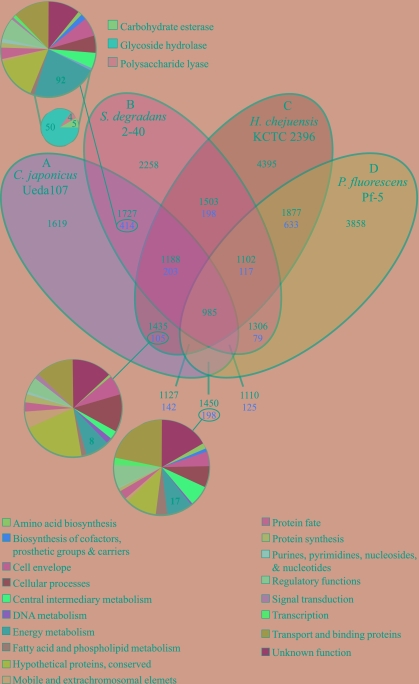
FIG. 2.
Whole-genome comparison of C. japonicus (A) and three related organisms (B to D). The Venn diagram shows the number of proteins shared (black) or unique (red) within a particular relationship. The large pie chart plots the number of gene sequences by main functional role category for C. japonicus. The small pie chart plots the distribution of predicted hydrolytic enzymes that target the plant cell wall and are shared by C. japonicus and S. degradans.

