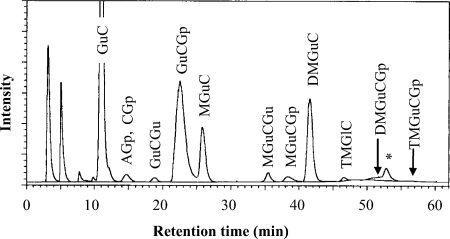
FIG. 4.
HPLC chromatogram of TPL1, the chloroform extract obtained from T. acidophilum grown in medium at pH 1.2. Figure 1 shows the abbreviations and structures of the polar lipids. The asterisk (*) indicates the peak of an unknown component. HPLC was performed with a Capcellpak silica SG80 column (2.0 mm [inside diameter] by 250 mm [length]) and monitored by ELSD. The eluents used were H1, chloroform, and H2, chloroform-methanol-trifluoroacetic acid (50:50:1 [vol/vol/vol]). The gradient program was H2 %(min) 0(0)-10(2)-50(42)-100(62) at 35°C at a flow rate of 0.25 ml/min.

