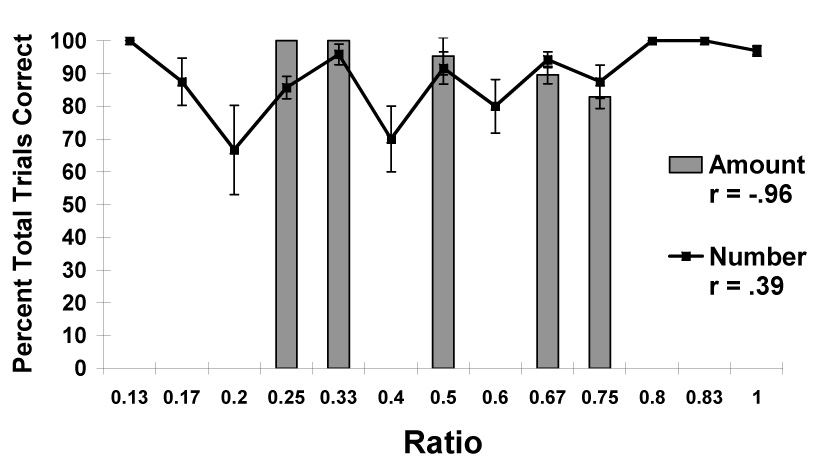
Figure 1.

Overall performance in choosing the larger amount in Experiment 1. Data are shown on the basis of the numerical ratio between sets and the ratio between the set with the smaller total amount of food compared to the set with the larger total amount of food. Error bars represent standard errors of means.
