
Figure 1.
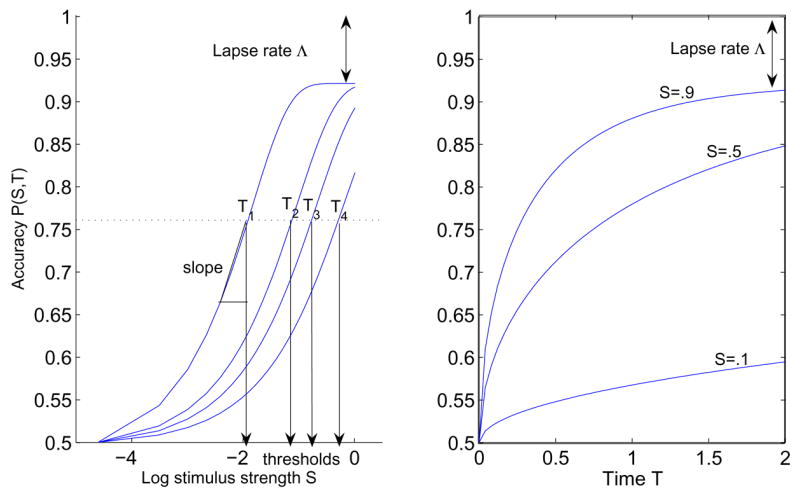
Left: A PMF P(S, T) plotted against stimulus strength S for viewing times T1 = 10s, T2 = 2s, T3 = 1s and T4 = 0.4s. Lower asymptote is 50% for unbiased 2AFC and upper asymptote is 1 − Λ ; thresholds and slope are labeled. Right: P(S, T) versus viewing time T for three stimulus strengths.