
Figure 10.
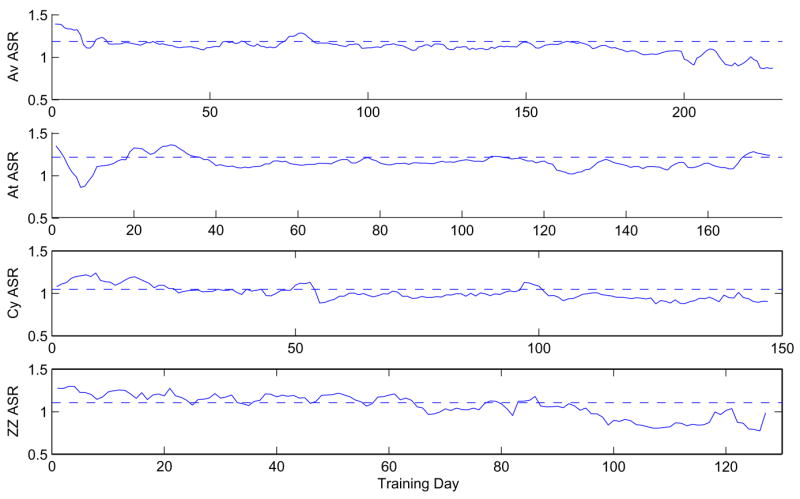
Average square residuals of one-parameter DDM fits to data for Av, At, Cy, and ZZ. Data is binned in 4-day sliding windows and daily fits are made for each window. Dotted lines show average square residuals for each full data set in a single bin, neglecting performance changes.