
Figure 3.
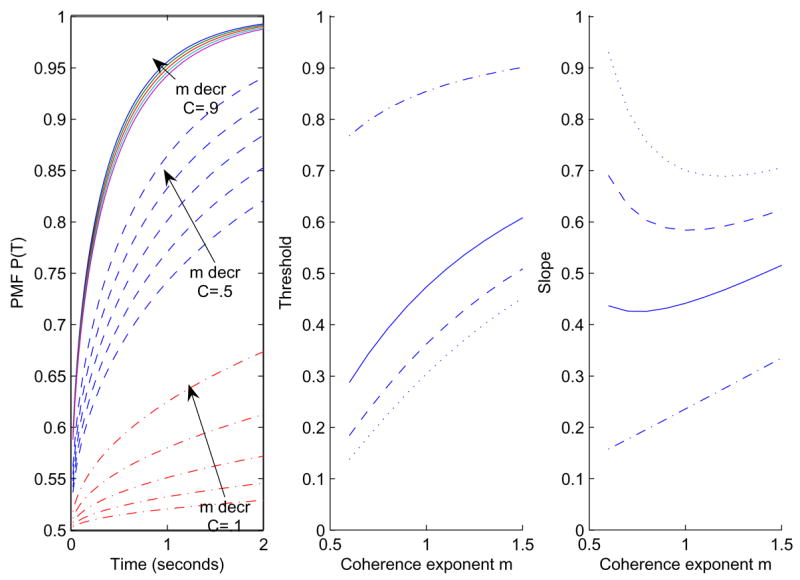
Effect of parameter m on the PMF P(T). Left: m varies from 1.6 to 0.8 for C = 0.9 (solid), C = 0.5 (dashed) and C = 0.1 (dash-dot), with a = 5. Center: the effect of m on threshold for a = 5 and T = 0.2s (dash-dot), T = 0.6s (solid), T = 1.0s (dashed) and T = 1.4s (dotted). Right: the corresponding slopes.