
Figure 9.
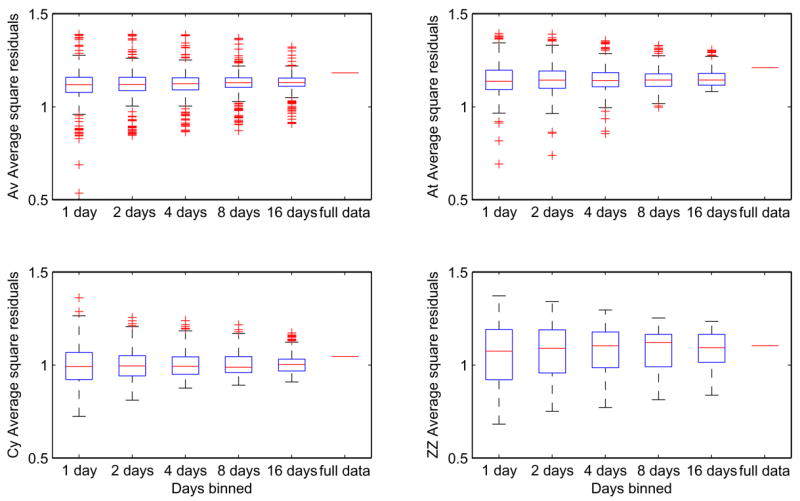
Distributions of average square residuals for subjects Av, At, Cy, and ZZ, fitted to the one-parameter DDM using n = 1, 2, 4, 8, and 16-day bins and the full data sets (left to right). Boxes and horizontal lines show upper and lower quartiles and medians; whiskers show extent of data or 1.5 × (interquartile range), whichever is smaller; crosses denote outliers.